Google Search Console is a free tool offered by Google. It helps webmasters understand how their website performs in the search engine. Google Search Console or GSC also enables webmasters to monitor important metrics, insights, and manual actions and penalties against their websites by Google.
Very few webmasters, however, truly understand what they can do with Google Search Console — and that’s a huge missed opportunity.
In this post, we list 10 things that you can do in Google Search Console that would help you understand more about your website and improve its search performance.
1. Check the indexation status of any URL
One of the most important and fundamental things you can do is to check if your website or a web page on your site is being indexed or not. If the page is not getting indexed by search engines for whatever reason, it won’t bring any search engine traffic — no matter what you do.
The URL Inspection tool in Google Search Console can confirm whether a URL is indexed and eligible to appear on the search engine results pages (SERPs). Use the search bar at the top to use the UR inspection tool.
The URL inspection tool also shows a few other important pieces of information that you can use:
- How Google discovered the web page
- When did Google crawl that URL the last time
- Check the canonical status of that page
- Check the mobile usability status
2. Check crawl errors
Sometimes, Google is not able to crawl web pages — let alone index them. It is important to identify any roadblocks and make it easy for Googe to crawl all the pages you want it to crawl.
The ‘Coverage’ report in Google Search Console shows all such crawl issues and more. You can use the results to improve your site performance, allow Google to crawl web pages on your site, or save Google’s crawl budget by preventing Google from even attempting to crawl these pages altogether.
3. Check search traffic
How many search engine users see your web page on the search engine results pages? How many of them click on your web pages on the SERPs?
The answers to these fundamental questions can help define your SEO and content marketing strategy.
The ‘Performance’ report in Google Search Console gives you all this information and more. You can see the total number of impressions and clicks for each web page individually or for the entire website.
Note: It is important to note that the clicks in Google Search Console are different than the organic sessions in Google Analytics. For a holistic and comprehensive view, it is recommended to monitor both of these metrics.
4. Check organic click-through rate (CTR)
With the information available on search impressions and clicks, you can calculate the organic click-through rate or CTR. But you don’t have to.
In the Search Performance report, Google Search Console also calculates and displays the organic click-through rate (CTR) for every URL you analyze.
One thing I like about this CTR report in Googe Search Console is that you can plot it on a line chart and see how CTR has been trending.

This is especially useful if you are running CTR tests by changing the meta content of a web page. By closely monitoring the ups and downs in the CTR, you can identify what works best and what does not.
You can also use this information and the results you get to refine your Googe Ads.
5. Check the average position for a web page
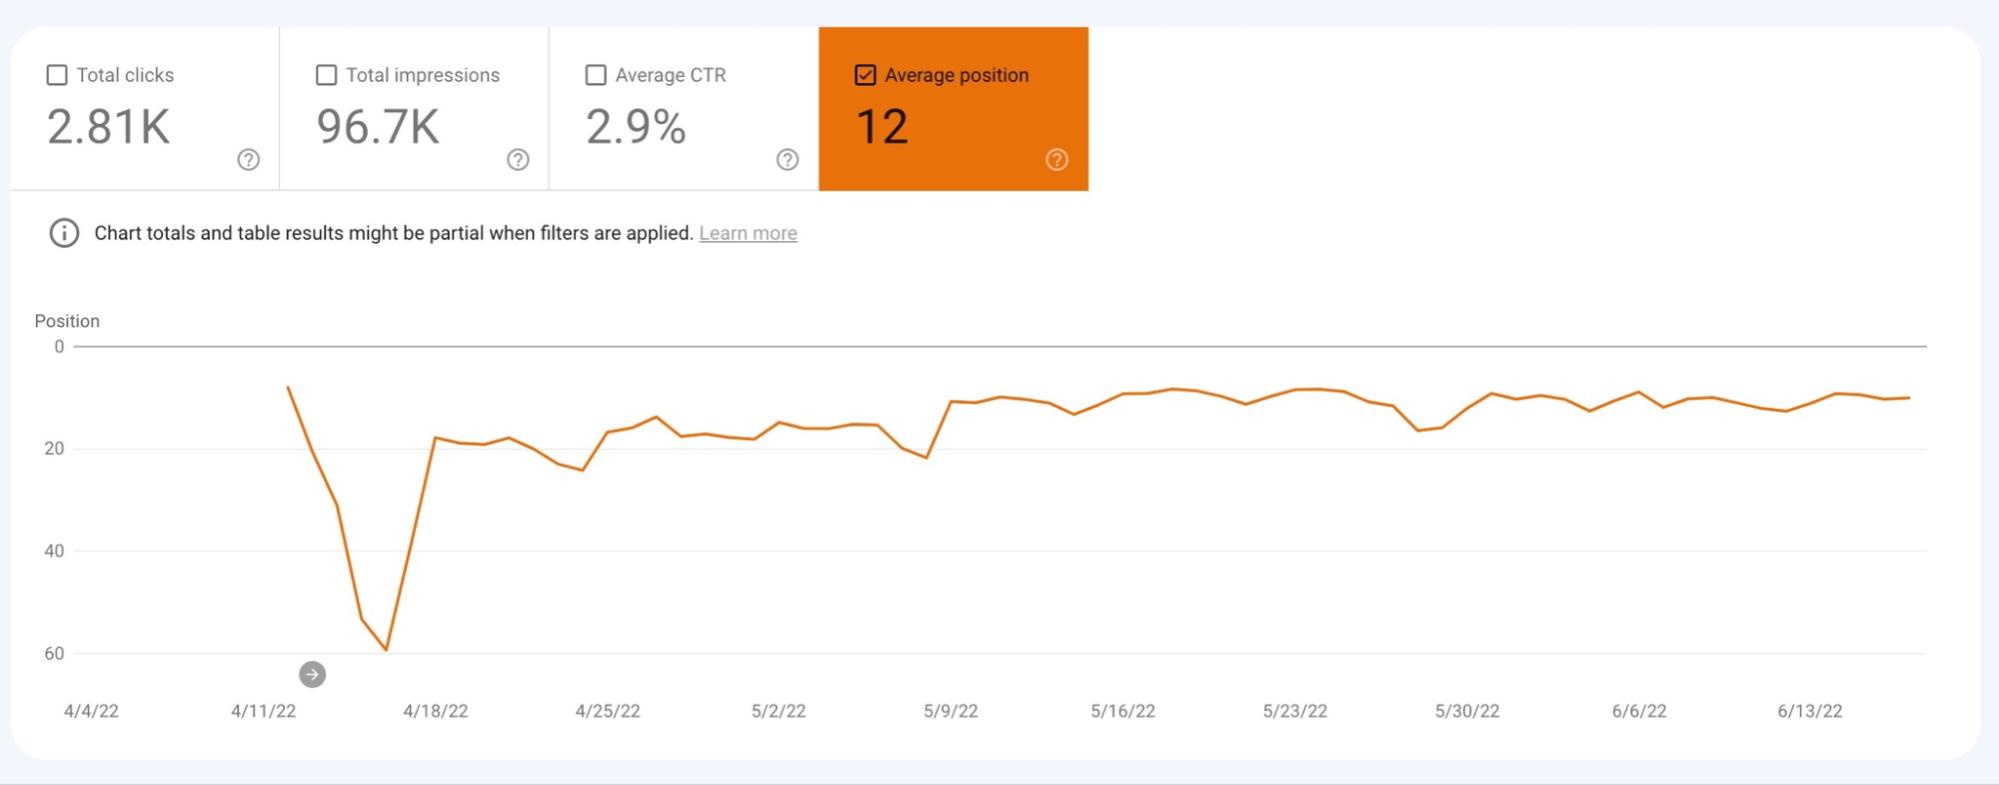
In the Performance report, you can also see the average position for any web page.
The average position helps you quickly identify if your web page is improving or not. Again, by using the line chart, you can also monitor trends, seasonalities, and possible effects of Google algorithm updates.

Whenever you update the contents of a web page or run a campaign for internal links or external links, we recommend noting down the dates. Then measure the results in the context of your SEO efforts to identify which strategy produced the best results.
Soon you will be able to identify patterns and the most effective SEO strategies that work for you.
6. Find top search queries
That’s great, but can Google Search Console give you information on how to optimize your web page in the first place?
Yes.
In Google Search Console, you can find the top search queries that people used in Google that triggered your web page to appear on the SERPs. That is extremely valuable information that you can use in multiple ways.
One of the most common strategies is to identify the top search queries and then make sure that your web page is optimized for them.
The ‘Queries’ data can be found on the main Performance report page. You may have to scroll down a bit; the first tab is for ‘Queries.’

7. Identify the top-performing web pages in Search
In addition to search queries, you can also use Google Search Console to find the top web pages that drive the most search traffic to your website.
You can find that information in the second tab on the same Performance report screen.
Although you can also find the top organic pages in Google Analytics, the report in Google Search Console also displays the average position for each of those pages in search engines. That gives you a bird’s eye view of where each page stands and where to focus more.
In addition, we also recommend using this report to identify if you really have the right pages on the list. Sometimes, for a B2B business, the list of top web pages may have a lot of informative content. This may affect conversion rates and revenue.
Having the right mix and, ideally, more commercial landing pages on that list can drive revenue.
8. Check internal and external links
Scroll down in the left sidebar menu to find the ‘Links’ section. In this report, you can find:
- The total number of external links
- The total number of internal links
- The websites that have linked to your site the most
- The most used anchor text
- Top linked pages externally
- Top linked pages internally
There are multiple ways you can use this report. One example is to identify pages with only 1-2 internal links.
9. Check and submit sitemaps
Want to check the status of your website’s sitemap? Or want to add a new sitemap to your site?
Google Search Consoles allows you to do that easily.
Just click on ‘Sitemaps’ in the left sidebar menu. There you can view the status of your current sitemap (if any) or submit a new sitemap.
10. Check page experience and core web vitals reports
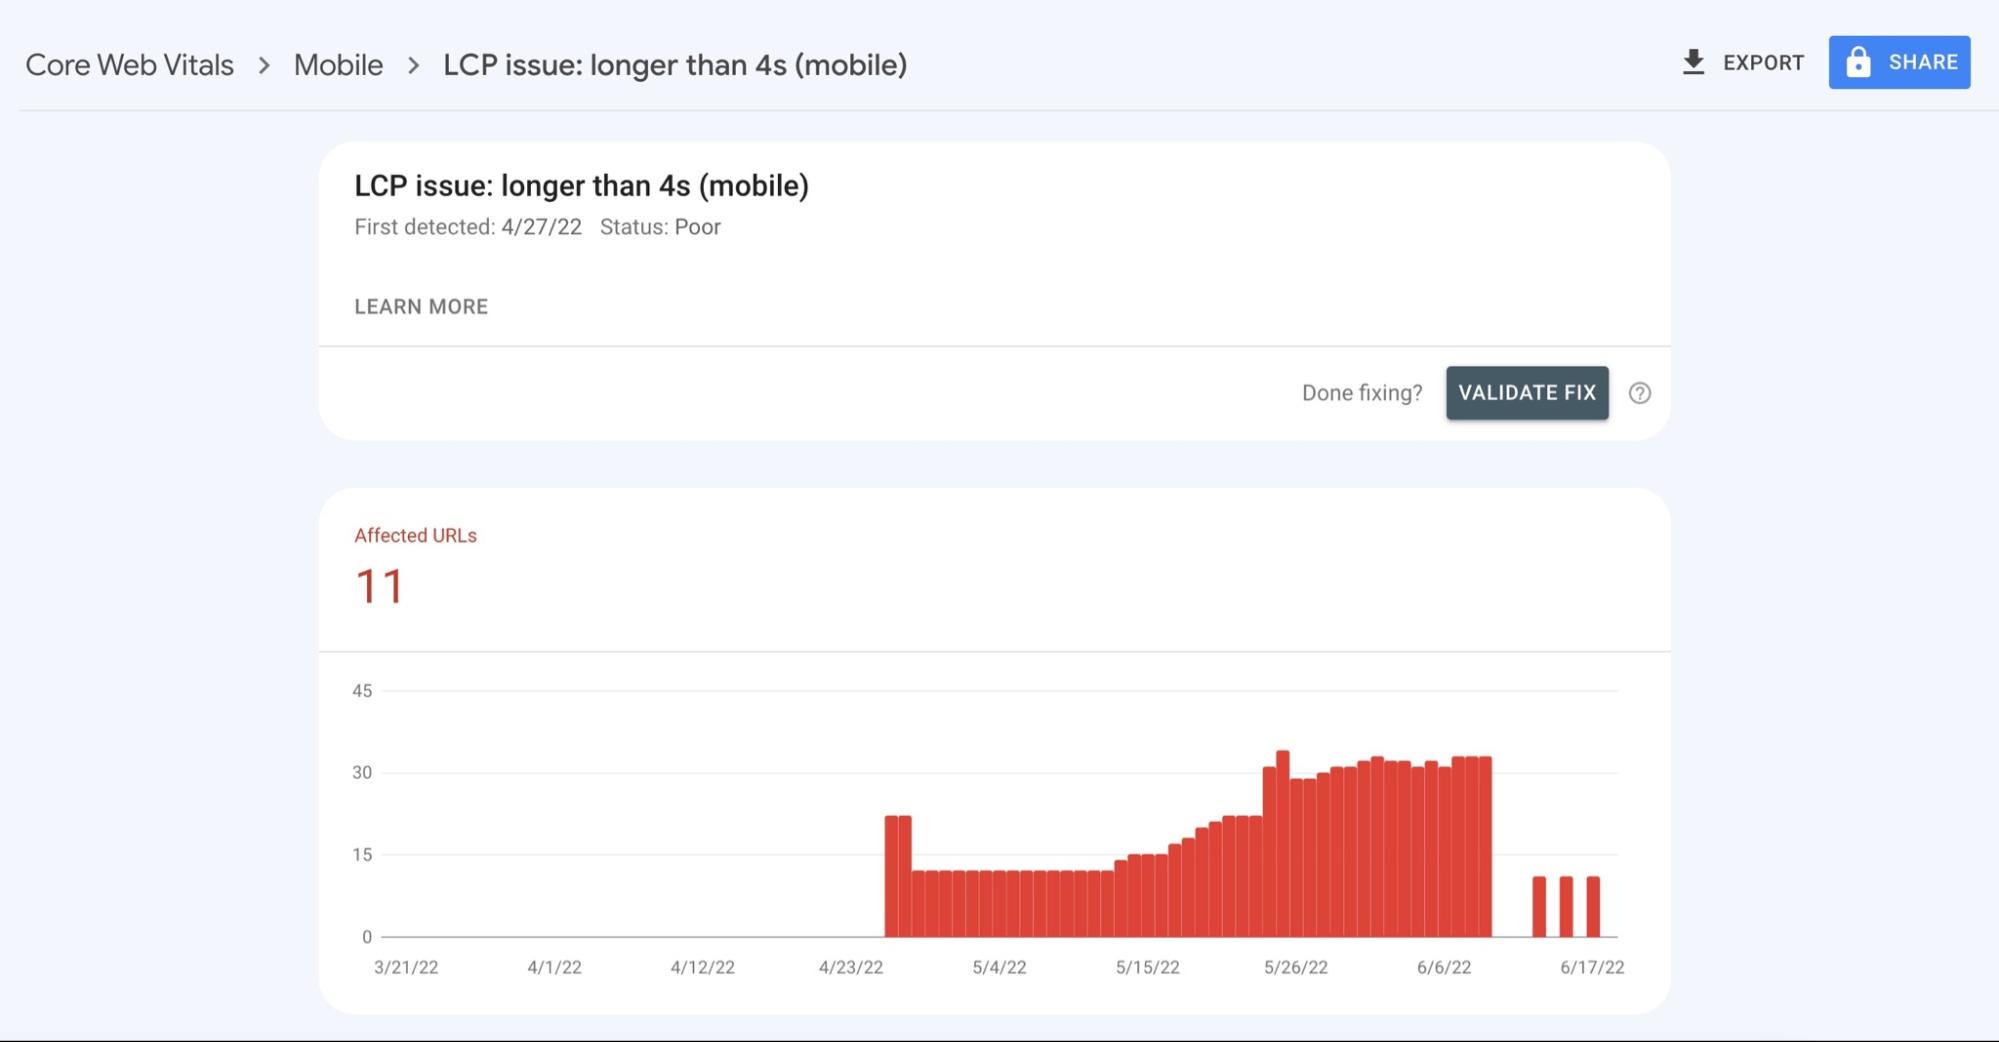
Google Search Console is an excellent resource for checking the core web vitals on your web pages. The report, which can be accessed by clicking the ‘Core Web Vital’s section in the left sidebar, is broken down to show:
- The number of URLs on your site with serious issues
- The number of URLs could do with improvements
- And the number of URLs that are good and don’t need any attention

If you open this report, you can find more granular information regarding what exactly the issue is and which pages are affected.

Conclusion
Google Search Console is an excellent tool for search engine professionals. It offers a ton of valuable data and insights that SEOs can use to improve the performance of their website in search results.
Use the tips mentioned in this article and find information and data regarding your site and site performance with the help of Google Search Console.